Choosing the Best Miami Beach Neighborhood for Airbnb Investment
Benefits of Airbnb Investments in Miami Beach Neighborhoods
Miami Beach, with its sun-kissed shores, vibrant nightlife, and rich cultural tapestry, has long been a hotspot for tourists from around the globe. As travel dynamics shift and tourists seek more personalized experiences, Airbnb and other short-term rental platforms have seen a surge in popularity. Investing in Airbnb properties in Miami Beach can offer a myriad of benefits, not only to property owners but also to the neighborhoods themselves. Here’s a look at how Airbnb investments are positively impacting various Miami Beach neighborhoods.
- Best Cities for Airbnb in USA: Top Big US Cities for Airbnb Investment
- A Comprehensive Guide on How to Start an Airbnb Business in Miami
- Airbnb Guide to Exploring Miami
- Guide to Short-Term Rental Regulations in Miami and Miami Beach
- The Secret Sauce to Skyrocketing Your Airbnb Profits in Miami
- From Homestead to Sunny Isles: Discover Miami-Dade’s Airbnb Investment Wonderland
- The Untapped Potential of Fort Lauderdale’s Airbnb Market
- Why Hollywood, Florida, is a Prime Location for Airbnb Investment
- The Prime Choices for Airbnb Business in Pensacola, Florida
Economic Boost
Increased Local Spending: Tourists staying in Airbnbs often frequent local cafes, shops, and attractions, injecting money directly into the local economy.
Job Creation: From property management to cleaning services, the demand for various roles increases with the growth of Airbnb properties.
Preservation and Revitalization
Historic Districts: Areas like the Art Deco Historic District can benefit as property owners are incentivized to restore and maintain historic buildings to attract guests.
Residential Areas: Neighborhoods outside the primary tourist zones can experience revitalization as they become attractive Airbnb locations, leading to property upgrades and better maintenance.
Diverse Tourist Offerings
Tailored Experiences: Different neighborhoods cater to different traveler needs, from the bustling nightlife of South Beach to the serene landscapes of North Beach. Airbnb properties allow tourists to choose a locale that aligns with their desired experience.
Cultural Exchange: Staying in residential neighborhoods allows tourists to immerse themselves in the local culture, fostering genuine exchanges between visitors and residents.
Increased Property Values
As demand for Airbnb-friendly properties rises, it can drive up property values in specific neighborhoods. Homeowners benefit from both rental income and property appreciation.
Community Development
Shared Amenities: Some Airbnb properties, especially those in condo associations, offer guests access to amenities like pools, gyms, and private beach access, making the entire building or community more attractive to potential renters or buyers.
Safety Improvements: An influx of tourists can lead to better lighting, increased security, and general safety improvements in certain areas.
Support for Local Events and Festivals
Neighborhoods hosting events, festivals, or art shows can benefit from Airbnb guests who prefer local accommodations over distant hotels, ensuring a steady flow of attendees and bolstering event success.
While the benefits are significant, it’s essential for investors to be aware of local regulations and community sentiments regarding short-term rentals. Proper management and adherence to local guidelines will ensure that the positive impact of Airbnb investments in Miami Beach neighborhoods continues to grow, fostering a harmonious relationship between property owners, residents, and tourists.
Explore Airbnb Management Miami Beach by MasterHost.
Best Miami Beach Neighborhood for Airbnb Investment
1. South Beach Area (ZIP: 33139) which comprises the following sub-neighborhoods
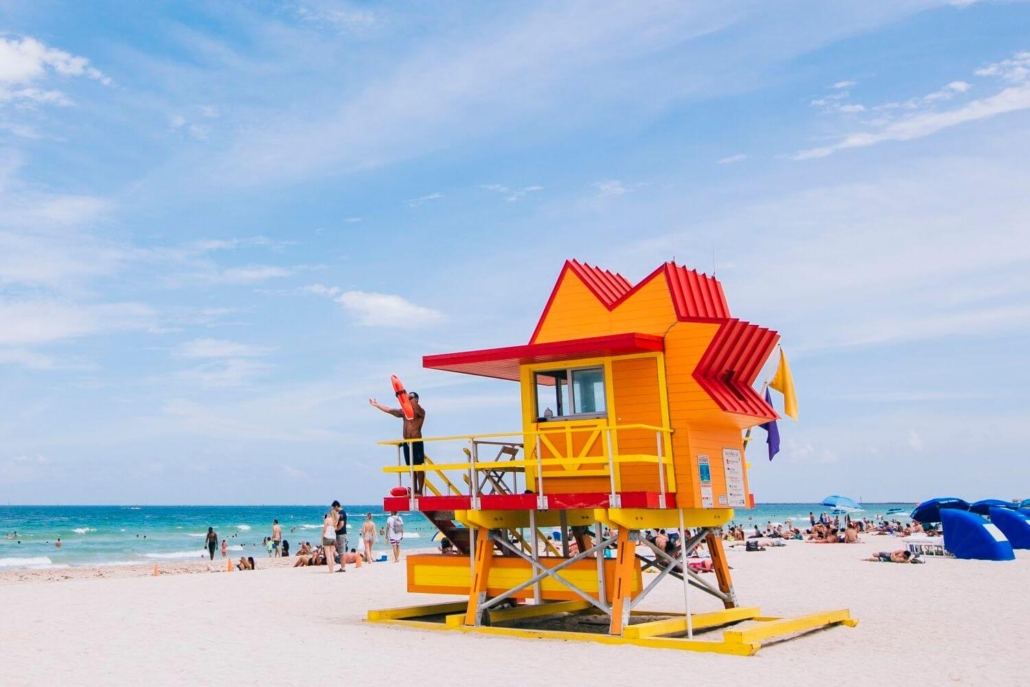
South Beach (SoBe): Famous for its vibrant nightlife, beautiful beaches, and historic Art Deco architecture.
Art Deco Historic District: Renowned for well-preserved Art Deco buildings. A major attraction for tourists.
Flamingo/Lummus: Known for its active atmosphere, shopping areas, and nightlife.
West Avenue: Features several residential buildings and shopping areas.
Palm and Hibiscus Islands: Mostly residential islands that offer a more tranquil stay.
Star Island: An exclusive island neighborhood known for luxury homes.
Airbnb Metrics of Miami Beach Area
- Average Daily Rate: $340
- Max Daily Rate in March: $431
- Occupancy Rate: 61%
- Max Occupancy Rate in March: 70%
- Total Listings: 3,295
- Rental Sizes Distribution: 1 Bedroom: 63%, 2 Bedroom: 23%, 3 Bedroom: 9%, 4 Bedroom: 4%, 5+ Bedroom: 2%
- Listings by Rental Type: Private Room: 15%, Entire Home: 84%
- Average Revenue: $75.2K
- Max Monthly Revenue in March: $8,200
- RevPAR: $216.7
- Weekend RevPAR: $395
- Best Month: March
- Market Score: 73
Learn more about AirDNA Submarket Performance Details.
Miami Beach Area Airbnb Metrics Analysis
Pricing and Occupancy Insights
The Average Daily Rate (ADR) of $340 suggests a relatively premium positioning of listings in this area. This could be attributed to its location, amenities, or the quality of listings available.
The spike to a Max Daily Rate of $431 in March indicates that March is a peak season for this area. This is due to various factors such as events, festivals, or seasonal trends that attract a higher number of tourists.
An Occupancy Rate of 61% is commendable, signifying more than half of the listings are typically occupied. Such a rate can ensure consistent revenue for hosts. The 9% rise to a Max Occupancy Rate of 70% in March reaffirms the fact that March is a particularly lucrative month for hosts in this area.
Listing Variety and Preferences
With 3,295 Total Listings, the area has a wide variety of options for potential renters, indicating a vibrant and competitive marketplace for hosts. The Rental Sizes Distribution reveals a dominant preference for smaller units, with 1-bedroom units making up 63% of the listings. This suggests that the area might be popular among solo travelers, couples, or business travelers. The relatively low percentages of larger properties indicates a niche market for larger groups or families.
A significant 84% of listings are categorized as Entire Home. This underscores that guests prefer privacy and exclusivity when they book in this area. Private Rooms, making up 15% of the listings, could cater to budget travelers or those willing to trade off some privacy for a more affordable rate.
Revenue and Market Health
An Average Revenue of $75.2K is substantial, reflecting the combination of a healthy ADR and a decent occupancy rate. The Max Monthly Revenue of $8,200 in March again points to March as the month with maximized earnings, aligning with the occupancy and rate peaks.
The RevPAR (Revenue Per Available Room) of $216.7 is an essential metric in the hospitality industry. It suggests that on average, each available room in the area earns about $216.7, which is a robust figure. A Weekend RevPAR of $395 indicates weekends are particularly strong in terms of earnings, possibly due to short weekend getaways or events.
March standing out as the Best Month is consistent with the other metrics, making it clear that hosts should capitalize on this month’s demand.
A Market Score of 73 (on a scale presumably out of 100) showcases the overall health and attractiveness of the South Beach area for Airbnb hosting.
Conclusion
The Miami Beach Area presents a flourishing environment for Airbnb hosts, with March emerging as the standout month for bookings and revenue. The prevalence of one-bedroom units and entire homes indicates a market preference for individuals or couples seeking private, intimate accommodations. A noteworthy observation is that a significant majority of the listings, totaling 3,167, are located in the South Beach neighborhood of this area, underscoring South Beach’s popularity and prominence in the Airbnb landscape. With a robust RevPAR and a high Market Score, potential hosts eyeing this area are poised for rewarding opportunities, especially if they focus on the bustling and vibrant South Beach locale.
2. Mid-Beach Area (ZIP: 33140) which comprises the following sub-neighborhoods

Oceanfront: Characterized by high-rise hotels and condominiums with scenic ocean views.
Mid-Beach: Sometimes called “Millionaire’s Row” because of its opulent oceanfront properties.
Bayshore: Offers a mix of residential properties and is known for the Bayshore Golf Course.
Nautilus: A primarily residential neighborhood.
Sunset Islands: A group of exclusive islands in Biscayne Bay, mainly residential.
La Gorce: Known for the La Gorce Country Club and upscale homes.
Airbnb Metrics of Mid-Beach Area
- Average Daily Rate: $304
- Max Daily Rate in February: $474
- Occupancy Rate: 59%
- Max Occupancy Rate in February: 71%
- Total Listings: 2,164
- Rental Sizes Distribution: 1 Bedroom: 47%, 2 Bedroom: 37%, 3 Bedroom: 11%, 4 Bedroom: 5%
- Listings by Rental Type: Private Room: 9%, Entire Home: 91%, Shared Room: 1%
- Average Revenue: $65.8K
- Max Monthly Revenue in March: $8,600
- RevPAR: $228.7
- Weekend RevPAR: $441
- Best Month: February
- Market Score: 62
AirDNA Submarket Performance Details
Mid-Beach Area Airbnb Metrics Analysis
Pricing and Occupancy Insights
The ADR of $304 reveals a mid-tier pricing strategy, making the listings in this area accessible to a wide range of travelers, from budget-conscious to those willing to splurge a bit.
A jump to a Max Daily Rate of $474 in February suggests that February is a high-demand month. The February peak in the Mid-Beach Area can be attributed to a mix of events and seasonal factors. Miami’s art scene, boating events, music festivals, and fashion events draw in global crowds. Additionally, the allure of Valentine’s Day getaways, school winter breaks, business conferences, and cruise ship departures further elevates the demand, making February a prime month for Airbnb accommodations in the Mid-Beach Area.
A general Occupancy Rate of 59% shows that more than half of the listings are often occupied, demonstrating a consistent demand throughout the year. The occupancy peaks to 71% in February, reiterating the fact that February is a hot month for bookings in this region.
Listing Variety and Preferences
With 2,164 Total Listings, there’s a diverse range of properties available, indicating a healthy competition among hosts and ample choices for guests. The Rental Sizes Distribution emphasizes that smaller units are more prevalent. 1-bedroom and 2-bedroom units collectively make up 84% of the listings. This suggests the area might be a hotspot for solo travelers, couples, or small families. Larger properties like 3-bedroom and 4-bedroom units are less common but could cater to larger groups or families seeking spacious accommodations.
An overwhelming 91% of listings are categorized as Entire Home, emphasizing guests’ preference for privacy and full spaces when booking in this region. Private Rooms make up 9% of the listings, catering to those who might be on a tighter budget or are open to shared accommodations. Shared Rooms, being just 1%, indicate a niche offering, which might appeal to backpackers or extremely budget-conscious travelers.
Revenue and Market Health
The Average Revenue stands at $65.8K, which is a combination of a reasonable ADR and consistent occupancy rate. The Max Monthly Revenue of $8,600 in March suggests that, despite February having higher daily rates and occupancy, hosts seem to maximize their earnings in March, possibly due to longer stays or additional services.
The RevPAR (Revenue Per Available Room) of $228.7 is an indicator of the earning potential of each available listing in the area. This figure suggests a healthy return on listings.
A Weekend RevPAR of $441 indicates that weekends are especially lucrative, possibly driven by short weekend vacations or special events in the vicinity.
February is identified as the Best Month, given its high daily rates and peak occupancy.
A Market Score of 62 (presumably out of 100) indicates a favorable environment for Airbnb hosting but also suggests there’s room for improvement or optimization in certain areas.
Conclusion
From the data analyzed, the Mid-Beach Area emerges as a dynamic and lucrative region for Airbnb hosting. February stands out as the peak month for bookings, and the notable preference for entire home listings suggests hosts in this area should focus on enhancing the privacy and exclusivity of their offerings. The strong RevPAR and Weekend RevPAR figures further emphasize the potential returns for hosts in the Mid-Beach Area. Given these insights, hosts can strategize to make the most of peak periods and tailor their services to meet the prevailing preferences of travelers to this region.
3. North Beach Area (ZIP: 33141) which comprises the following sub-neighborhoods

North Beach: This is one of the primary neighborhoods in the ZIP code, known for its historic districts, quieter beaches, and a more relaxed vibe compared to the bustling South Beach.
Normandy Isles: This is a set of islands located within the city limits of Miami Beach. It’s known for the Normandy Shores Golf Club and its picturesque residential areas.
Isle of Normandy: This is another island neighborhood, distinct from Normandy Isles, with beautiful waterfront homes.
Biscayne Point: Located to the north of Normandy Isles, this is a primarily residential area with many waterfront properties.
North Bay Village is a distinct island municipality situated in Miami-Dade County, Florida. Nestled between the cities of Miami and Miami Beach, it originally existed as a sandbar. Over the years, it underwent significant development and eventually emerged as a thriving residential and commercial hub. The village consists of three islands: North Bay Island, Harbor Island, and Treasure Island. Boasting picturesque views of Biscayne Bay and the Miami skyline, North Bay Village is renowned for its array of waterfront properties, restaurants, and serene atmosphere. Its unique blend of tranquility and proximity to the bustling Miami areas makes it a sought-after location for both residents and visitors.
Airbnb Metrics of North Beach Area
- Average Daily Rate: $311.1
- Max Daily Rate in April: $336
- Occupancy Rate: 52%
- Max Occupancy Rate in February: 65%
- Total Listings: 1,022
- Rental Sizes Distribution: 1 Bedroom: 68%, 2 Bedroom: 17%, 3 Bedroom: 6%, 4 Bedroom: 7%, 5+ Bedroom: 3%
- Listings by Rental Type: Private Room: 12%, Entire Home: 87%, Shared Room: 1%
- Average Revenue: $58.6K
- Max Monthly Revenue in March: $5,600
- RevPAR: $168.7
- Weekend RevPAR: $335
- Best Month: March
- Market Score: 60
AirDNA Submarket Performance Details
North Beach Area Airbnb Metrics Analysis
Pricing and Occupancy Insights
With an Average Daily Rate (ADR) of $311.1, the North Beach Area offers accommodations that can cater to a moderately upscale clientele, providing a balance between luxury and affordability. The slight rise to a Max Daily Rate of $336 in April suggests that April sees a marginal increase in demand, potentially due to springtime attractions or events.
A general Occupancy Rate of 52% signifies that while there’s consistent demand, there’s also room for growth in optimizing occupancy rates. A peak Occupancy Rate of 65% in February indicates that this month experiences higher bookings, possibly due to winter getaways or specific events in the area.
The area boasts 1,022 Total Listings, suggesting a competitive market with a variety of options for potential guests. Rental Sizes Distribution indicates a clear dominance of 1-bedroom units, which comprise 68% of the listings. This suggests that solo travelers or couples are the primary target market.
Listing Variety and Preferences
A significant 87% of the listings offer the Entire Home. This emphasizes that guests visiting the North Beach Area prefer having an entire space to themselves, valuing privacy and comfort.
Private Rooms make up 12%, catering to those who might be more budget-conscious or are open to a more communal living experience. The minimal Shared Room listings at 1% indicate a niche market, appealing to backpackers or ultra-budget travelers.
Revenue and Market Health
The Average Revenue of $58.6K is reflective of the combined effects of the ADR and occupancy rates. The Max Monthly Revenue hitting $5,600 in March implies that despite February having a higher occupancy rate, hosts might earn more in March, perhaps due to longer stays or added services.
The RevPAR (Revenue Per Available Room) at $168.7 gives an indication of the earning potential of each listing. While it’s a solid figure, there might be opportunities to optimize it further. A Weekend RevPAR of $335 suggests that weekends are peak times, with potential events or attractions drawing more guests during these days.
Interestingly, while February has the highest occupancy, March stands out as the Best Month in terms of revenue. This suggests that while more guests come in February, those in March might be spending more.
A Market Score of 60 (assuming a scale of 100) points to a healthy market but also indicates potential areas for improvement or growth.
Conclusion
The North Beach Area offers a promising Airbnb market, with a notable inclination towards one-bedroom listings and entire homes. While February and March emerge as significant months for hosts, there’s evident room for enhancing guest experiences, optimizing listings, and potentially boosting both occupancy and revenue.
Explore :
