
Top 10 Best Cities in Canada for Airbnb
As a country, Canada is a great choice for an Airbnb business investment. The general market conditions are comfortable, while the legislation is not as strict as in some other countries. Many entrepreneurs have already demonstrated their successful cases there, and the common lesson that can be learned from all of them is that choosing the correct city to operate in is essential.
How to buy an Airbnb property is explained here.
Best Cities for Airbnb Investments in Canada
| Cities | Revenue |
| Whistler | CA$6,577 |
| Montreal | CA$3,259 |
| Calgary | CA$2,926 |
| Canmore | CA$7,521 |
| Vancouver | CA$5,138 |
| Quebec | CA$4,179 |
| Toronto | CA$3,520 |
| Matawinie | CA$4,144 |
| Niagara Falls | CA$3,187 |
| Ottawa | CA$2,501 |
There are multiple cities that could easily interest an aspiring Airbnb entrepreneur in Canada. Some of them are large megapolises with sustainable and predictable incomes, while the others are rapidly developing towns with huge potential for the future. In the article, the most attractive options will be reviewed with all the essential information for each city.
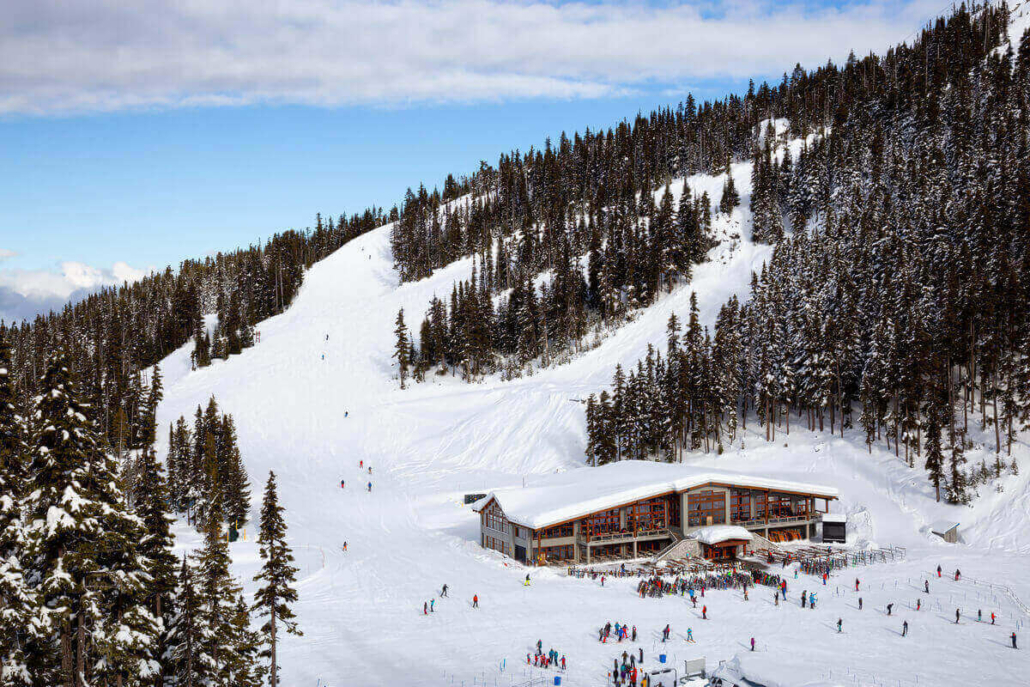
Whistler
- Average Daily Rate (ADR): CA$332
- Booked Nights Per Year: 237
- Occupancy Rate: 65%
- Active Airbnb Listings: 2,522
- Average Monthly Revenue: CA$6,577
- Average Annual Revenue: CA$78K
- YoY Revenue Change: +32.57%
- Seasonality: Strong
- Most Profitable Month: February
- Airbnb Laws: Strict
Whistler continues to stand out as a high-opportunity short-term rental market, mainly because traveler demand stays steady through the year. In other words, hosts are not relying on a single peak window to earn well. Vacation rental occupancy in Whistler is about 237 nights annually, and the occupancy rate is 65%. Meanwhile, the average daily rate sits at CA$332, which supports healthy revenue while still feeling realistic for guests.
At the same time, the income trend looks encouraging. Across November 2024 to October 2025, average annual revenue reached about CA$78K. In addition, average monthly revenue came in around CA$6,577. Even better, year-over-year revenue climbed by 32.57%, which signals growing momentum rather than a flat market. So, for owners who manage pricing, reviews, and turnover well, Whistler can still deliver standout results.
Because Whistler has clear seasonal waves, smart planning pays off. February ranks as the most profitable month, and winter demand gives the market a strong backbone. However, other months can still perform well when a listing offers the right mix of comfort, location, and guest experience. Also, with 2,522 active listings, the market feels competitive, yet it is not closed off. Instead, well-positioned homes with strong operations can still rise quickly, even under strict local rules.
- 5 Things to Know Concerning Airbnb Profitability in Whistler
- How to Start an Airbnb Business in Whistler
- Host tips: a local guide to Whistler for your guests
- Most Important Dates When Managing Airbnb in Whistler
Montreal

- Average Daily Rate (ADR): CA$158
- Booked Nights Per Year: 252
- Occupancy Rate: 69%
- Active Airbnb Listings: 6,147
- Average Monthly Revenue: CA$3,259
- Average Annual Revenue: CA$39K
- YoY Revenue Change: +1.4%
- Seasonality: Strong
- Most Profitable Month: August
- Airbnb Laws: Strict
Montreal belongs on a shortlist of strong Airbnb investment cities because it combines cultural pull with repeatable demand. For instance, the city draws festival crowds, food lovers, and weekend travelers all year. At the same time, it attracts business visitors and people coming for university events. Because guest demand comes from many directions, hosts are not forced to rely on one narrow season to stay booked.
From a performance perspective, Montreal offers a solid mix of affordability and consistency. Over the year, listings average 252 booked nights, while occupancy sits around 69%. Meanwhile, the average daily rate stays near CA$158, which can feel accessible for guests while still supporting steady revenue. In addition, average monthly revenue is about CA$3,259, which totals roughly CA$39K per year. Since year-over-year revenue increased by 1.4%, the market looks stable, and that can suit investors who prefer predictable patterns.
Even so, timing and execution still shape results. August tends to deliver the best returns, so hosts who prepare early can capture summer pricing and longer stays. However, other months can perform well when the listing feels easy and comfortable. For example, fast Wi-Fi, clear instructions, and a smooth self check-in can lift reviews and ranking. Although local rules are strict, a compliant setup can protect the business and reduce surprises. As a result, Montreal can remain a strong option for long-term Airbnb investors.
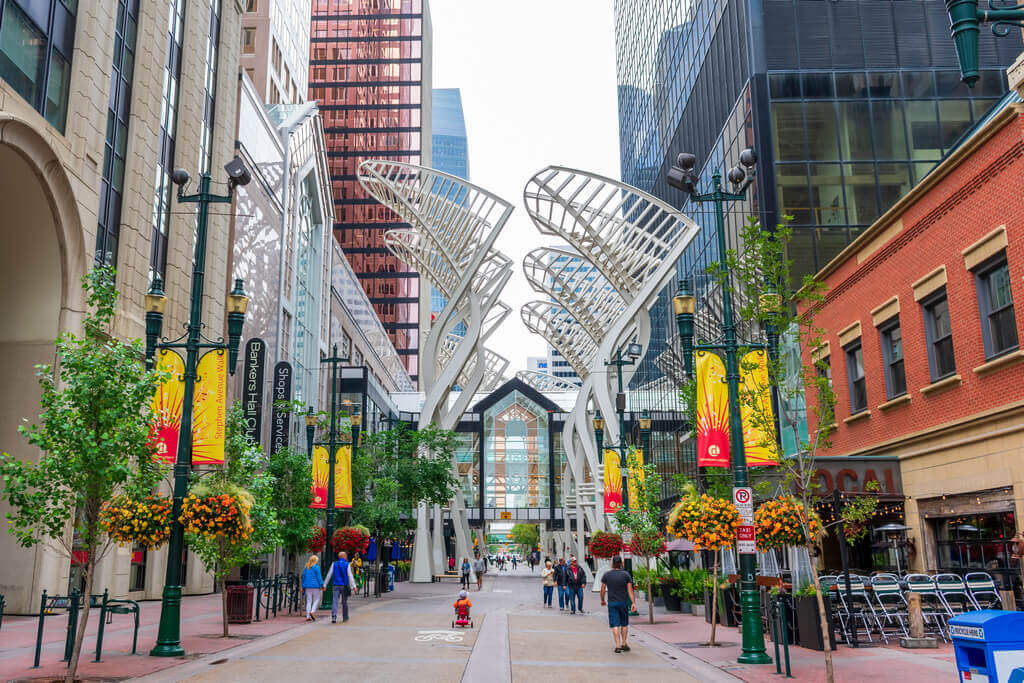
Calgary
- Average Daily Rate (ADR): CA$142
- Booked Nights Per Year: 252
- Occupancy Rate: 69%
- Active Airbnb Listings: 4,532
- Average Monthly Revenue: CA$2,926
- Average Annual Revenue: CA$35K
- YoY Revenue Change: +21.82%
- Seasonality: Strong
- Most Profitable Month: June
- Airbnb Laws: Strict
Calgary is a strong Airbnb investment option if you want a growing market with solid demand and room to differentiate. For example, the city pulls in business travelers, event visitors, and tourists using Calgary as a base for day trips toward the Rockies. Because of that mix, bookings can stay steady beyond the usual summer rush. Also, Calgary often appeals to families and longer-stay guests, which can reduce turnover and help keep operations smoother.
From a numbers standpoint, Calgary performs well for consistency. Over the year, rentals average 252 booked nights, while occupancy sits at 69%. Meanwhile, the average daily rate comes in at CA$142, which can feel competitive for guests while still supporting reliable income. In addition, average monthly revenue is around CA$2,926, which totals roughly CA$35K annually. Since year-over-year revenue increased by 21.82%, the market shows real momentum, which is a good sign for new hosts entering with a strong setup.
Seasonality is still important, so planning ahead makes a difference. June tends to be the top month, and early summer demand can lift performance across many parts of the city. However, Calgary can also benefit from sports schedules, conferences, and winter travel, especially when a listing offers a warm, practical stay. Although local rules are strict, a compliant operation helps protect cash flow and avoids headaches. As a result, Calgary can be a smart choice for investors who want growth potential without relying on ultra-high nightly rates.
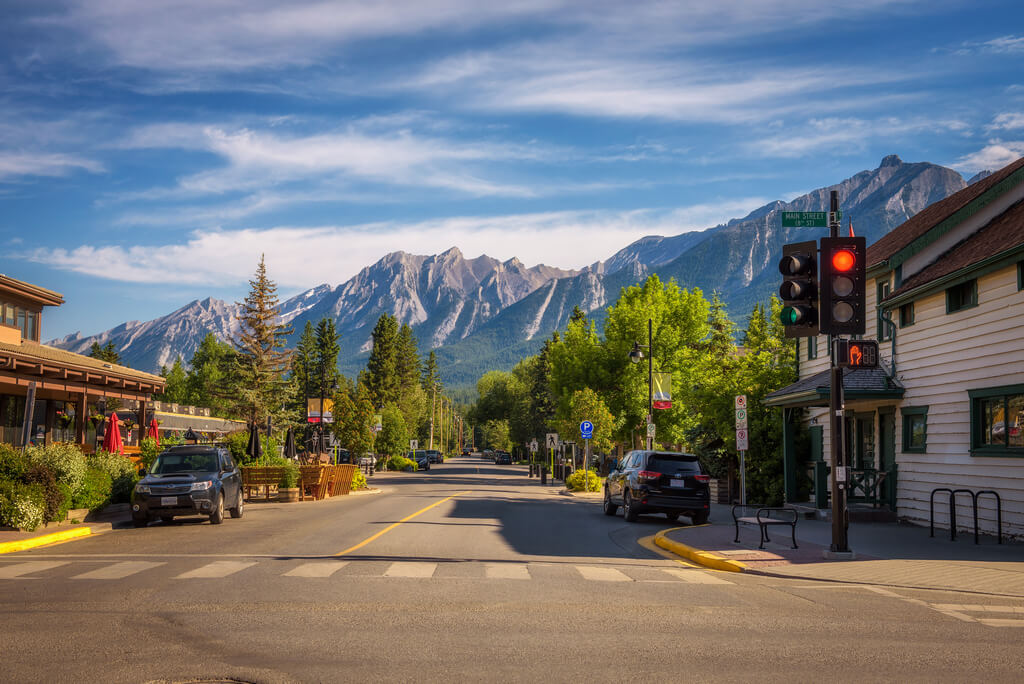
Canmore
- Average Daily Rate (ADR): CA$321
- Booked Nights Per Year: 292
- Occupancy Rate: 80%
- Active Airbnb Listings: 2,117
- Average Monthly Revenue: CA$7,521
- Average Annual Revenue: CA$90K
- YoY Revenue Change: +8.19%
- Seasonality: Strong
- Most Profitable Month: July
- Airbnb Laws: Lenient
Canmore stands out as a top-tier Airbnb investment market because it combines high nightly pricing with elite booking consistency. To begin with, the location does a lot of the work. Guests choose Canmore for mountain access, quick trips to Banff, and a calm small-town feel that still looks premium. Because the trip experience feels “special,” travelers often accept higher rates, especially for well-designed condos and homes with views, patios, and parking.
The market stats reinforce that investment appeal. Canmore posts an 80% occupancy rate, which is remarkably strong for a resort-style destination. At the same time, the average daily rate reaches CA$321, so hosts earn more per booked night than in many major cities. In addition, average monthly revenue is about CA$7,521, which supports an average annual revenue near CA$90K. Since revenue is up 8.19% year over year, the market still shows healthy forward movement, not just a one-time spike.
Canmore also works well operationally, which matters just as much as revenue. July is typically the top month, yet demand stays strong across other seasons because visitors come for hiking, skiing, and weekend escapes. Also, local rules are described as lenient, which can reduce friction for owners compared with stricter markets. With 2,117 active listings, competition exists, but it is not overwhelming. As a result, a well-positioned property with strong photos, clear check-in, and consistent upkeep can perform at a very high level and remain a standout long term.
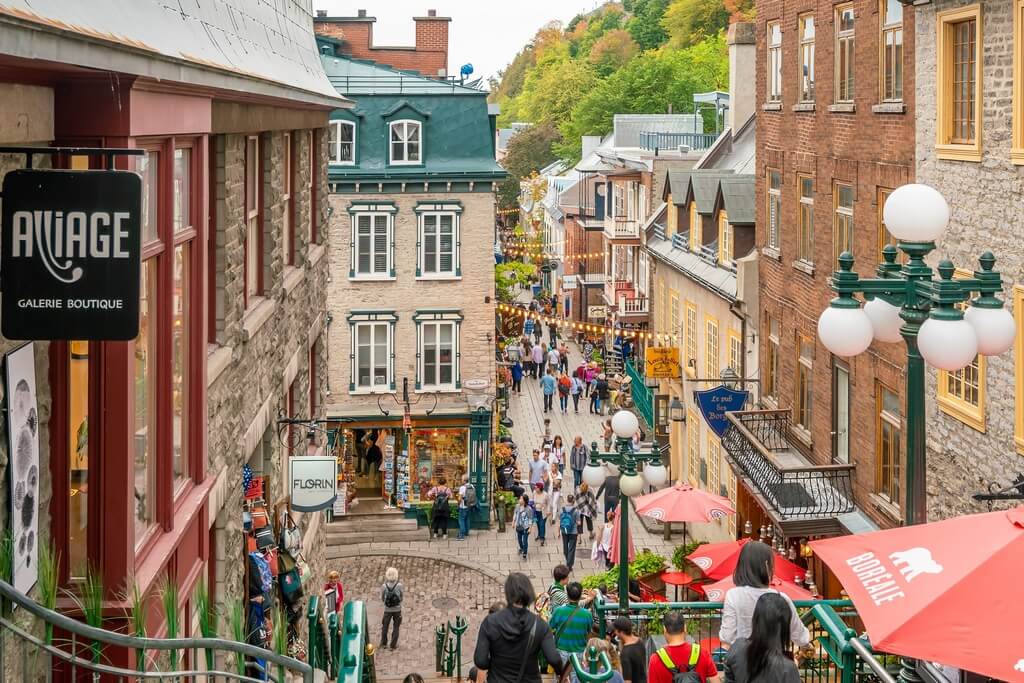
Quebec
- Average Daily Rate (ADR): CA$187
- Booked Nights Per Year: 266
- Occupancy Rate: 73%
- Active Airbnb Listings: 1,313
- Average Monthly Revenue: CA$4,179
- Average Annual Revenue: CA$50K
- YoY Revenue Change: +12.47%
- Seasonality: Strong
- Most Profitable Month: August
- Airbnb Laws: Strict
Quebec City is a strong Airbnb market because it delivers high occupancy without needing extreme nightly prices. To start, the city offers a unique, historic atmosphere that draws both Canadian and international travelers. Because many visitors come specifically for Old Quebec, food, and events, well-placed rentals can attract steady demand.
Performance metrics look solid. Occupancy averages 73%, while the average daily rate is about CA$187. In addition, hosts earn around CA$4,179 per month, or roughly CA$50K per year. Since revenue rose by 12.47% year over year, the market shows healthy momentum.
August is usually the top month, so summer strategy matters. However, winter can also perform well thanks to seasonal charm and holiday travel. With about 1,313 active listings, competition feels manageable. Although local rules are strict, a compliant, high-quality setup can help investors stand out and build reliable returns.
Vancouver

- Average Daily Rate (ADR): CA$213
- Booked Nights Per Year: 292
- Occupancy Rate: 80%
- Active Airbnb Listings: 3,621
- Average Monthly Revenue: CA$5,138
- Average Annual Revenue: CA$61K
- YoY Revenue Change: +22.45%
- Seasonality: Strong
- Most Profitable Month: July
- Airbnb Laws: Strict
Vancouver is one of Canada’s most attractive Airbnb markets because it combines premium travel demand with unusually high booking consistency. For starters, the city draws visitors for ocean-and-mountain scenery, cruises, concerts, and sports. At the same time, it appeals to remote workers and longer-stay guests who want walkable areas and easy transit. Because of that, many listings can keep strong momentum even outside peak holiday weeks.
The performance data reflects that strength. Vancouver reaches an 80% occupancy rate, which is among the best levels you’ll see in a large Canadian city. Meanwhile, the average daily rate sits at CA$213, so hosts can maintain solid pricing without pushing rates into “luxury-only” territory. In addition, the average monthly revenue is about CA$5,138, while average annual revenue lands near CA$61K. Since revenue grew by 22.45% year over year, the market shows clear upward movement, which is encouraging for investors who want both stability and growth.
July is usually the biggest month, so summer strategy matters. However, Vancouver is not only a summer story. Shorter winter getaways, spring travel, and event-driven weekends can still fill calendars when a listing feels easy to book and easy to stay in. For example, clear check-in steps, great bedding, and a simple but thoughtful kitchen setup often boost reviews and ranking. Although local rules are strict, that can raise the quality bar in a good way. As a result, compliant hosts who run a polished operation can still perform exceptionally well.
- Why Investing in Airbnb in Vancouver is a Great Idea
- Airbnb Regulations in Vancouver
- Top Vancouver Neighbourhoods for Airbnb
- Vital Dates to Consider When Handling Airbnb in Vancouver
Matawinie
- Average Daily Rate (ADR): CA$261
- Booked Nights Per Year: 186
- Occupancy Rate: 51%
- Active Airbnb Listings: 1,227
- Average Monthly Revenue: CA$4,144
- Average Annual Revenue: CA$49K
- YoY Revenue Change: +25.92%
- Seasonality: Strong
- Most Profitable Month: August
- Airbnb Laws: Strict
Matawinie has grown into a popular Airbnb market because it matches what many travelers want now: nature, privacy, and a real break from the city. Instead of museums and nightlife, guests come for cabins, lakes, and quiet weekends that feel restorative. Because it works well for road trips and short escapes, the area attracts couples, families, and small groups looking for an easy getaway.
Even with lower occupancy than major cities, the income potential can stay strong. Matawinie averages about 51% occupancy, yet the ADR reaches CA$261. In other words, hosts can earn more per booked night when the property feels unique and delivers the “retreat” experience. In addition, average annual revenue is around CA$49K, and revenue rose by 25.92% year over year, which signals rising demand.
August is usually the best month, so summer planning matters. However, off-season performance can improve when a listing adds comfort features like a hot tub, sauna, or fire pit. Also, clear directions, good photos, and reliable Wi-Fi often increase bookings. Although local rules are strict, hosts who stay compliant and focus on quality can still do very well.
Toronto

- Average Daily Rate (ADR): CA$171
- Booked Nights Per Year: 255
- Occupancy Rate: 70%
- Active Airbnb Listings: 9,799
- Average Monthly Revenue: CA$3,520
- Average Annual Revenue: CA$42K
- YoY Revenue Change: +12.78%
- Seasonality: Strong
- Most Profitable Month: August
- Airbnb Laws: Strict
Toronto remains a dependable short-term rental market because the city rarely has a true “off” season. For example, corporate travel, concerts, sports games, and conferences keep demand moving across the calendar. As a result, many hosts can build predictable booking patterns instead of relying on a few peak weeks. That stability also supports better planning for cleaning, maintenance, and pricing updates.
The numbers back up that consistency. A typical Toronto short-term rental books about 255 nights per year and reaches a 70% occupancy rate. Meanwhile, the average daily rate sits at CA$171, which makes it easier to attract a wide range of guests, from weekend visitors to longer stays. In addition, the market’s average annual revenue is around CA$42K, and revenue increased by about 12.78% year over year, which points to steady improvement.
Toronto’s strongest advantage is variety. Different areas draw different guest types, so you can position a listing for business travelers, families, or tourists depending on the property and location. Also, August often leads as the top-earning month, thanks to summer travel and major events. At the same time, a strong transit network and walkable neighborhoods help guests feel comfortable without a car, which can improve reviews. Even though local rules are strict and competition is high, hosts who run a compliant, guest-first operation can still stand out and keep calendars full.
Top reasons why Airbnb in Toronto is a great investment can be read here.
- 5 Toronto Airbnb Neighborhoods Through the Eyes of Local Hosts
- An In-depth Look at 5 Toronto Neighborhoods for Airbnb
- Profitability of Airbnb in Toronto: 5 Key Insights to Be Aware Of
- Hosting Recommendations: A Guide to Toronto for Your Guests
Niagara Falls

- Average Daily Rate (ADR): CA$200
- Booked Nights Per Year: 193
- Occupancy Rate: 53%
- Active Airbnb Listings: 1,156
- Average Monthly Revenue: CA$3,187
- Average Annual Revenue: CA$38K
- YoY Revenue Change: +25.93%
- Seasonality: Strong
- Most Profitable Month: August
- Airbnb Laws: Lenient
Niagara Falls stays popular for Airbnb investment because it is a bucket-list destination with built-in demand. In other words, many trips are intentional, not random. Visitors come for the falls, the attractions, wineries, and quick weekend escapes. Because the destination is easy to sell, well-located listings can attract bookings quickly, especially in peak season.
The market also shows a strong mix of rate potential and growth. The average daily rate is about CA$200, which helps boost earnings when travel demand spikes. Meanwhile, occupancy averages 53%, which reflects the seasonal nature of the area. However, revenue grew by 25.93% year over year, which signals rising interest and better pricing power. In addition, hosts average around CA$3,187 per month, or roughly CA$38K per year.
August is typically the best month, so summer strategy matters most. Still, you can improve shoulder-season performance by focusing on convenience. For example, parking, simple self check-in, and family-friendly layouts often convert better than flashy extras. With about 1,156 active listings, competition feels manageable. Since local rules are considered lenient, many investors find the setup easier than in stricter cities, as long as they follow local requirements.
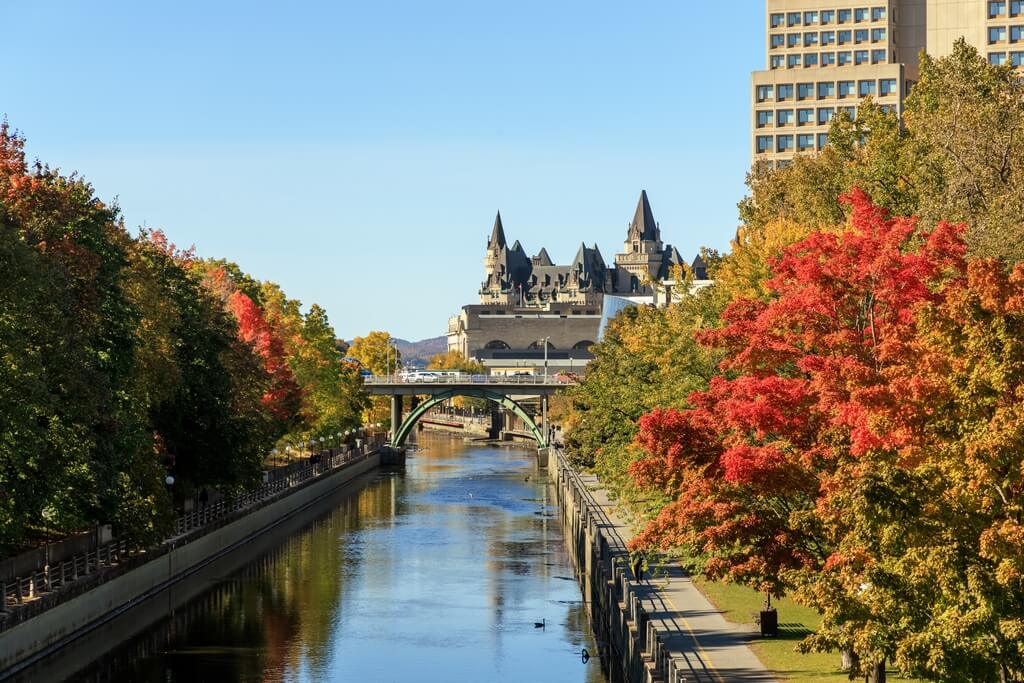
Ottawa
- Average Daily Rate (ADR): CA$124
- Booked Nights Per Year: 237
- Occupancy Rate: 65%
- Active Airbnb Listings: 1,722
- Average Monthly Revenue: CA$2,501
- Average Annual Revenue: CA$30K
- YoY Revenue Change: +12.24%
- Seasonality: Strong
- Most Profitable Month: October
- Airbnb Laws: Strict
Ottawa can be a smart Airbnb investment when you want steadier, lower-drama demand in a capital city that runs on year-round travel. To begin with, Ottawa attracts government and corporate visitors, conference guests, and families coming for short trips. Because many stays are purpose-driven, bookings can feel more predictable than in markets that depend heavily on offering “vacation vibes.” Also, guests often value practicality here, so clean design, fast Wi-Fi, and an easy check-in can move the needle quickly.
Ottawa’s pricing sits on the accessible side, which can help keep calendars active. The average daily rate is about CA$124, while occupancy averages around 65%. In addition, hosts earn roughly CA$2,501 per month, which adds up to about CA$30K per year. Since revenue increased by 12.24% year over year, the market shows positive movement, even without high nightly rates. So, investors who focus on efficiency and guest experience can still build a solid return.
What makes Ottawa interesting is the seasonal pattern. October often leads as the top month, which fits fall travel and event schedules. However, Ottawa can also perform well across other months when a listing targets the right guest. For example, units that support business stays with a desk, strong lighting, and reliable heating often win better reviews. Although local rules are strict, they can also reduce random competition over time. As a result, compliant hosts with consistent operations can build stable performance in Ottawa.


